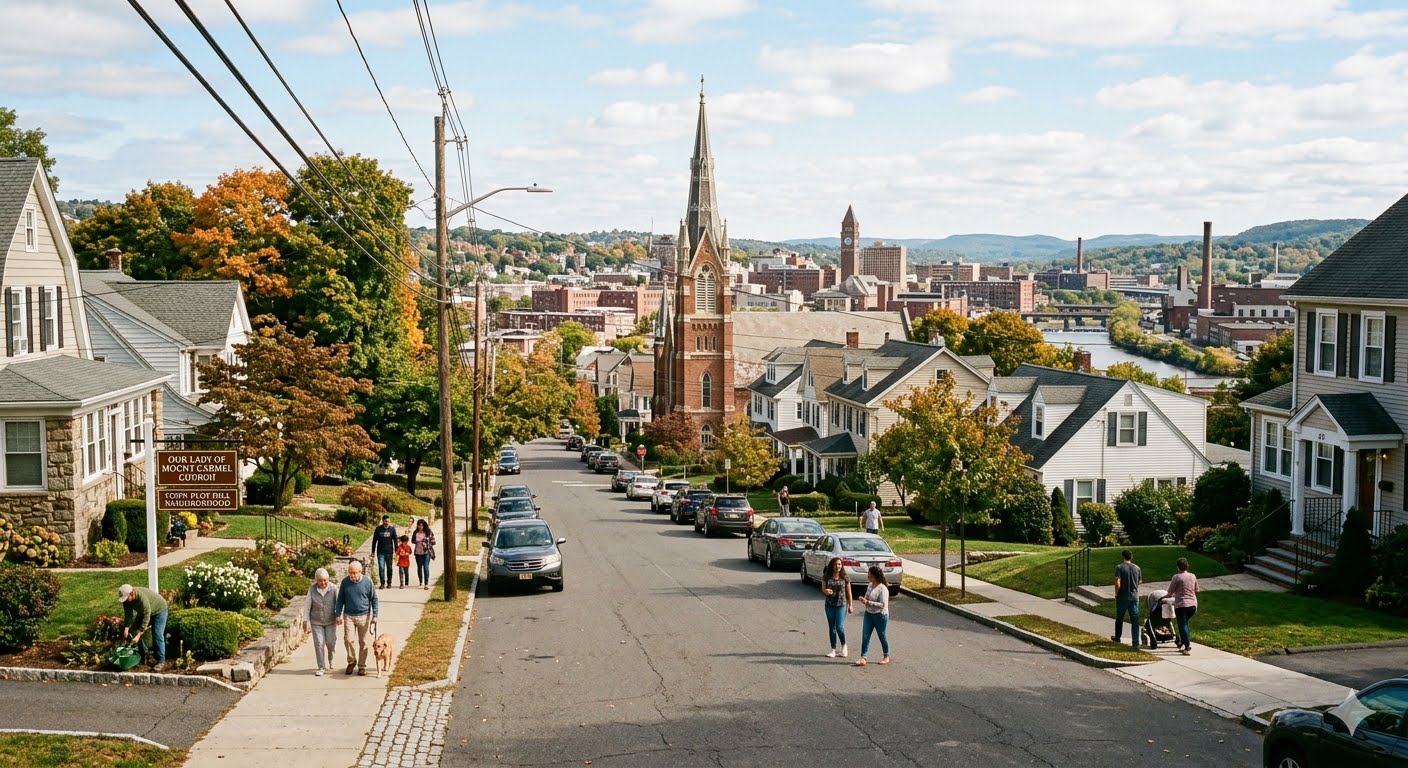
THE ANATOMY OF TOWN PLOT HILL
A Comprehensive Demographic, Socioeconomic, and Cultural Monograph of Waterbury, Connecticut’s Historic Southwestern Stronghold
CHAPTER 1: GEOGRAPHIC PREMISE & LANDSCAPE TOPOGRAPHY
Town Plot—frequently designated by locals as “Town Plot Hill”—occupies a high, southwest ridge in Waterbury, Connecticut. The neighborhood spans the 06708 ZIP code. It sits above the Naugatuck River Valley. This elevation provides clear, panoramic views of the downtown skyline, the historic Brass Mill industrial footprints, and the green hills of neighboring Litchfield County.
                       [ NORTH: Oronoke & West Side ]
                                     |
[ WEST: Middlebury Border ] --- TOWN PLOT HILL --- [ EAST: Naugatuck River / Rt. 8 Corridor ]
                                     |
                       [ SOUTH: Naugatuck Town Line ]
Physical Borders
The geographic perimeter is bounded by distinct natural and industrial lines:
- Eastern Border: Defined by the steep drop into the Naugatuck River valley, running parallel to the Route 8 expressway.
- Western Border: Shifting gradually into the wooded, suburban terrain near the Oronoke neighborhood and the Middlebury town line.
- Northern Border: Edged by the West Side neighborhood and the Interstate 84 transit corridor.
- Southern Border: Defined by the municipal boundary of the Borough of Naugatuck.
Urban Design
The street layout balances strict urban design with suburban adaptation. The lower slopes feature dense grid patterns. These give way to winding, tree-lined streets as the elevation increases toward the peak of the hill.
This layout reduces through-traffic, preserving a quiet residential character just minutes from major interstate junctions. The high elevation also insulates the neighborhood from valley humidity and industrial noise, making it one of the city’s most historically desirable residential areas.
CHAPTER 2: POPULATION CHARACTERISTICS & AGE COHORTS
Town Plot has a resident base of approximately 9,412 residents. The population structure is highly stable, characterized by long residential tenure and multi-generational households.
+-----------------------------------------------------------------------+

| TOWN PLOT COHORT DISTRIBUTION                                         |
+-----------------------------------------------------------------------+

| 0–14 Years       (16.8%)  ==================                          |
| 15–24 Years      (11.9%)  =============                               |
| 25–44 Years      (25.4%)  ===========================                 |
| 45–64 Years      (27.1%)  ============================                |
| 65 Years & Over  (18.8%)  ====================                        |
+-----------------------------------------------------------------------+
Median Age Dynamics
The median age in Town Plot is 41.2 years. This makes it older than the Waterbury municipal average (36.2 years) but younger than the rural towns of Litchfield County. The age distribution shows two distinct population clusters:
- The Senior Anchor (65+ Cohort): At 18.8% of the population, this group represents the historical memory of the hill. Many are retirees who bought homes during the mid-century manufacturing boom and chose to age in place.
- The Working Professional Core (25–64 Cohort): Combining for 52.5% of the population, this segment forms the primary economic engine of the neighborhood. It includes mid-career professionals, municipal workers, and tradespeople.
Household Composition
The neighborhood is built around stable family structures:
- Married-Couple Households: 54.2% of all households are married-couple units, which is higher than the city-wide baseline.
- Average Household Size: 2.58 persons per unit.
- Single-Person Households: 24.1%, predominantly occupied by aging widows or young professionals commuting to New Haven or Hartford counties.
CHAPTER 3: RACIAL, ETHNIC, AND ANCESTRY MATRIX
Town Plot has long served as a key cultural center for Waterbury’s European immigrant waves, particularly from Italy. While the neighborhood has diversified over the last three decades, its historic cultural institutions and community identity remain strong anchors.
+-----------------------------------------------------------------------+

| RACIAL & ETHNIC PROFILE                                               |
+-----------------------------------------------------------------------+

| White (Non-Hispanic)            | 62.4%                               |
| Hispanic or Latino              | 21.8%                               |
| Black or African American       |  9.5%                               |
| Asian                           |  3.1%                               |
| Two or More Races               |  2.5%                                |
| Other                           |  0.7%                               |
+-----------------------------------------------------------------------+
Ancestry and Cultural Roots
Self-reported ancestry data reveals deep ties to early 20th-century immigration:
- Italian Ancestry: 38.4% of residents claim direct Italian lineage, making Town Plot one of the most concentrated Italian-American enclaves in western Connecticut.
- Irish Ancestry: 12.1%, establishing a strong secondary cultural presence.
- Portuguese & Lebanese Ancestry: Small but distinct pockets that have influenced local businesses and religious institutions.
The Modern Mosaic
The neighborhood is currently experiencing a peaceful integration of new resident groups. The growth of the Hispanic and Latino population (21.8%) is driven primarily by middle-class Puerto Rican and Dominican families moving up from the dense rental districts of downtown and the East End. This demographic shift has introduced new businesses while maintaining the neighborhood’s high rate of homeownership.
CHAPTER 4: ECONOMIC PROFILE & LABOR FORCE INDICES
The economic profile of Town Plot reflects a resilient, upper-middle-class working community. The neighborhood maintains a high level of financial independence from municipal assistance.
+-----------------------------------------------------------------------+

| INCOME TIER DISTRIBUTION (HOUSEHOLDS)                                 |
+-----------------------------------------------------------------------+

| Under $35,000                   | 14.1%                               |
| $35,000 to $74,999              | 26.8%                               |
| $75,000 to $124,999             | 34.2%                               |
| $125,000 to $199,999            | 18.5%                               |
| $200,000 and Over               |  6.4%                               |
+-----------------------------------------------------------------------+
Financial Benchmarks
- Median Household Income: $84,612, outperforming the broader Waterbury city-wide average.
- Per Capita Income: $38,944.
- Poverty Rate: 6.1%, well below both the city average and national benchmarks.
Employment Sectors
The workforce balances public service, healthcare, and traditional trades:
- Healthcare & Social Assistance (22.4%): Driven by proximity to Waterbury Hospital and Saint Mary’s Hospital.
- Educational Services (14.8%): Comprising public school teachers, administrators, and faculty at nearby colleges.
- Public Administration & Safety (11.2%): A high concentration of Waterbury police officers, firefighters, and municipal workers live on the hill.
- Skilled Manufacturing & Construction Trades (16.5%): Precision machinists, electricians, and contractors who maintain ties to the region’s industrial heritage.
CHAPTER 5: REAL ESTATE HOUSING STOCK & INFRASTRUCTURE
The built environment of Town Plot is defined by low vacancy rates, high homeownership, and well-preserved mid-century architecture.
+-----------------------------------------------------------------------+

| HOUSING METRIC COMPARISON                                             |
+-----------------------------------------------------------------------+

| Metric                          | Town Plot      | Waterbury Baseline |
+-----------------------------------------------------------------------+

| Homeownership Rate              | 71.4%          | 41.2%              |
| Rental Occupancy Rate           | 28.6%          | 58.8%              |
| Median Housing Unit Value       | $318,500       | $215,000           |
| Housing Vacancy Rate            | 3.8%           | 8.9%               |
+-----------------------------------------------------------------------+
Architectural Taxonomy
The neighborhood’s housing stock was largely built between 1950 and 1979, an era marked by rapid middle-class suburban expansion.
      [ Cape Cod ]                 [ Raised Ranch ]               [ Split-Level ]
      /##\    /##\                   /##########\                   /##########\
     /    \  /    \                 /            \                 /     |      \

    |  []  ||  []  |               |  []  ||  []  |               |  []  |  []  |
====|______||______|====       ====|______||______|====       ====|______|______|====
  (1.5 Stories + Dormers)         (Garage on Lower Level)        (Multi-Level Living)
- The Raised Ranch & Split-Level: These configurations dominate the upper terraces of the hill. They typically offer 3 bedrooms, 2 bathrooms, finished basements, and built-in garages, appealing directly to families.
- The Classic Cape Cod: Common on the mid-slope streets, these neat 1.5-story homes feature steep roofs and gabled dormers.
- Historic Multi-Family Enclaves: The lower edges of the hill feature well-maintained two-family homes. Unlike multi-family properties in other parts of the city, these are often owner-occupied, with family members living across both units.
CHAPTER 6: INSTITUTIONAL ANCHORS & SOCIAL CAPITAL
The social cohesion of Town Plot is sustained by a network of historic religious, educational, and civic institutions.
       [ TOWN PLOT CIVIC & SOCIAL INFRASTRUCTURE ]
                            |
       +--------------------+--------------------+

       |                                         |
[ SACRED HEART CHURCH ]                 [ OUR LADY OF MT. CARMEL ]
(Spiritual & Cultural Core)             (Historic Feast & Italian Prep)

       |                                         |
[ CHASE PARK & RECREATION ]             [ TOWN PLOT HILL ASSOC. ]
(Green Space & Youth Sports)            (Zoning & Neighborhood Advocacy)
Religious Institutions
- Our Lady of Mount Carmel Church: Located at the base of the hill, this parish is the historic spiritual home of the neighborhood’s Italian founders. It hosts the annual Feast of Our Lady of Mount Carmel, a major summer festival that draws thousands of former residents back to the neighborhood.
- St. Denis and Sacred Heart Parishes: These institutions have adapted over time to offer bilingual services, supporting the area’s growing Hispanic population.
Civic and Green Spaces
- Chase Park: Located on the northern edge of the neighborhood, this park provides baseball fields, playgrounds, and open green space. It serves as a central gathering place for youth leagues and neighborhood events.
- The Town Plot Hill Association: A volunteer civic group that advocates for local property owners. The association reviews zoning laws, coordinates neighborhood cleanups, and maintains an active dialogue with city hall to protect the neighborhood’s residential character.
CHAPTER 7: EDUCATIONAL ATTAINMENT & ACADEMIC PATHWAYS
Educational attainment in Town Plot is characterized by high high-school graduation rates and a steady rise in post-secondary degrees among younger residents.
+-----------------------------------------------------------------------+

| ADULT EDUCATIONAL ATTAINMENT (AGE 25+)                                |
+-----------------------------------------------------------------------+

| Less than High School Diploma   |  8.2%                               |
| High School Graduate/GED        | 36.4%                               |
| Some College/Associate Degree   | 28.1%                               |
| Bachelor's Degree               | 18.5%                               |
| Graduate or Professional Degree |  8.8%                               |
+-----------------------------------------------------------------------+
Local Schools and Educational Access
The neighborhood relies on a mix of local public institutions and regional private schools:
- B.W. Tinker Elementary School: A public elementary school located directly within the neighborhood. It serves as an educational and social anchor for local young families.
- Our Lady of Mount Carmel School: A private parochial school option that combines academic education with traditional religious instruction.
- Secondary and Higher Ed Access: High school students transition into West Side public high schools or regional technical schools. The neighborhood’s close proximity to Naugatuck Valley Community College (NVCC) and the UConn Waterbury campus supports a large population of commuter college students.
CHAPTER 8: COMMERCIAL ECOSYSTEM & ECONOMIC LIFE
The commercial landscape of Town Plot is focused along Highland Avenue, the neighborhood’s central transit artery. This commercial zone avoids the footprint of national big-box chains, favoring independent, family-owned businesses that have operated on the hill for decades.
[ HIGHLAND AVENUE: THE ECONOMIC spine OF TOWN PLOT ]
========================================================================
[Artisanal Bakeries] ---> [Specialty Italian Markets] ---> [Family Dining]
========================================================================

   |                         |                                |
  (Fresh Bread & Pastries)  (Imported Goods & Meats)         (Neighborhood Hubs)
The Specialty Food Economy
The local economy is anchored by traditional Italian food businesses. These independent establishments attract customers from across the region, bringing steady consumer traffic to Highland Avenue:
- Artisanal Bakeries: Long-standing bakeries provide fresh bread, pastries, and traditional desserts daily.
- Specialty Italian Markets: Independent grocers specialize in imported oils, cheeses, house-made sausages, and prepared foods.
- Family-Owned Restaurants: Local dining spots serve as community meeting points, anchoring the neighborhood’s social and commercial life.
Neighborhood Retail Security
The commercial corridor is rounded out by practical services, including independent pharmacies, neighborhood salons, and small auto repair shops. The steady patronage of local residents helps insulate these businesses from broader economic downturns, maintaining a low commercial vacancy rate along Highland Avenue.
CHAPTER 9: DEMOGRAPHIC TRANSITIONS & THE FUTURE OF THE HILL
Town Plot is currently navigating a natural generational transition. As older homeowners retire and downsize, their properties are drawing a new generation of families to the hill.
[ THE GENERATIONAL PIPELINE ]
========================================================================
[ Retiring Homeowners ] ---> [ Real Estate Turnover ] ---> [ Young Working Families ]
(Aging in Place, 65+)        (Low Vacancy, Solid Value)     (In-Migration, 25-44 Cohort)
========================================================================
Key Strengths and Challenges
- Value Retention: The neighborhood remains highly attractive because it balances suburban space with city convenience. It offers a more affordable option for buyers compared to high-tax surrounding towns like Middlebury, helping maintain stable property values.
- Infrastructure Maintenance: As the housing stock ages, maintaining the neighborhood’s mid-century infrastructure and residential streets remains a core priority for local property owners.
- Preserving Social Fabric: The neighborhood’s long-term stability relies on its ability to integrate new residents into its established civic networks, ensuring that historic institutions like the Town Plot Hill Association remain active and representative of the evolving community.
CHAPTER 10: SYNTHESIS & STATISTICAL ABSTRACT
Town Plot stands out within Waterbury as a resilient example of mid-century suburban design. It balances a proud cultural history with a modern, stable economic base. Its demographic data highlights a community defined by high homeownership, low poverty, and strong neighborhood stability.
Core Demographic Reference Table
| Statistical Indicator | Town Plot Profile | Municipal Benchmark (Waterbury) |
|---|---|---|
| Total Population Base | 9,412 | 114,403 (City Total) |
| Median Household Income | $84,612 | Distinctly lower city baseline |
| Homeownership Percentage | 71.4% | 41.2% (City Baseline) |
| Residential Vacancy Rate | 3.8% | 8.9% (City Baseline) |
| Median Residential Property Value | $318,500 | $215,000 (City Median) |
| Primary Cultural Component | Italian-American (38.4%) | Broadly diversified urban distribution |
| Poverty Percentage Index | 6.1% | Significantly higher urban center baseline |
| Predominant Housing Style | Single-Family Detached | Denser Multi-Family / Multi-Tiered |
